Creating Infographics for Classroom Use
Graphics can be useful in demonstrating complicated numbers and relationships and they are often used as pieces of longer presentations. Everyone has had experience with graphs and flow charts as an appendix or piece of that Powerpoint presentation. One especially effective way of using graphics is by creating stand-alone Infographics.
Infographics are visual representations of data which make the information more accessible and clear for readers or learners. These “informational” graphics when used in education are intended to facilitate the learning of complicated material but not substitute for deeper explanation. Think of them as spectacular tools for jumpstarting student engagement in complex activities or with sophisticated issues.
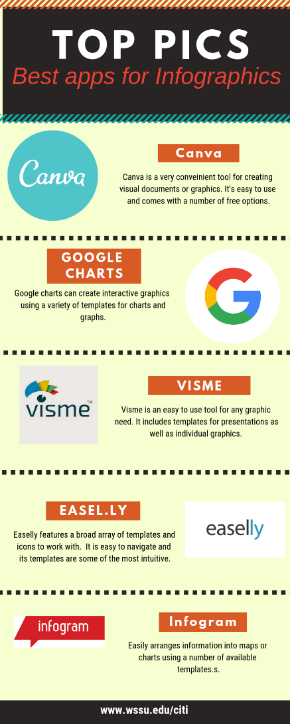
The premise of the Infographic is to allow students to utilize additional senses (visual) to digest large amounts of information.For a deeper discussion of this concept, view this TED talk by David McCandless. However, regardless of how you employ an infographic in the classroom, it can be an effective and helpful tool. And they can be easy to create with the graphic apps available. See the example below that I created in Canva of the five “top” infographic apps.
Tools for Infographics
All of these apps can be accessed for free, but they do provide extra features for a subscription rate. The good news is that for very basic infographic design, the free version can do well.
The first featured app is Canva. It has easy-to-use features and functionality that allows “anyone” to create a variety of engaging content. It is fairly simple to navigate and includes a lot of good templates with helpful categories.
Here is a quick introduction of Canva and what it can do.
Google Charts is an interactive Web service that creates graphical charts from user-supplied information. All aspects of this Google product are free and the convenience of it is that it will synch with your Google files and other accounts.
Visme is advertised as a “no tech or design skills required” content creator, which suggests its ease of use. It is a tool geared more toward infographics than some apps and it includes a vast library of images and icons. Two useful options that the tool provides are the ability to offer voiceover to your graphics and some animation options. This video provides a quick demonstration.
Easel.ly offers many free features for infographic development and it allows users to customize fonts and animation. The expanded edition ($4/month) offers more control and is one of the cheapest of the apps to upgrade.
Infogram takes a hand at developing the actual design of your infographic based on the information you input. Data is interpreted by the software in to various graphics, which you can edit or arrange. The free graphics are good but the purchased version allows better user input.
References
Gretter, S. (2015, 10 Nov) Using Infographics for Teaching and Learning. Inside Teaching MSU.
Stewart, C. (nd) 16 incredible tools for creating infographics. Creative Blog.